Measured
Numbers instead of adjectives. Every statement about impact comes with a unit, a scope and a period.
kg CO₂e · scope · year
A movement for honest climate data
Climate claims are easy to make and hard to check. We build the tools that put the data behind every claim where anyone can see it.
The problem
When nobody can see the numbers, a company doing real work and a greenwasher look the same. That is unfair to everyone who does the work.
of green claims in the EU give vague, misleading or unfounded information.
of green claims have no supporting evidence at all.
of all green labels offer weak or no verification.
Source: European Commission, Green claims.
Claim or data
Switch the view and watch vague words turn into figures you could check, compare and challenge.
Illustrative figures. The format follows what CO₂ Manager and EcoEPS record.
Follow one batch
This is what EcoEPS records when someone hands in EPS packaging. Each step is signed with time, place and the person responsible.
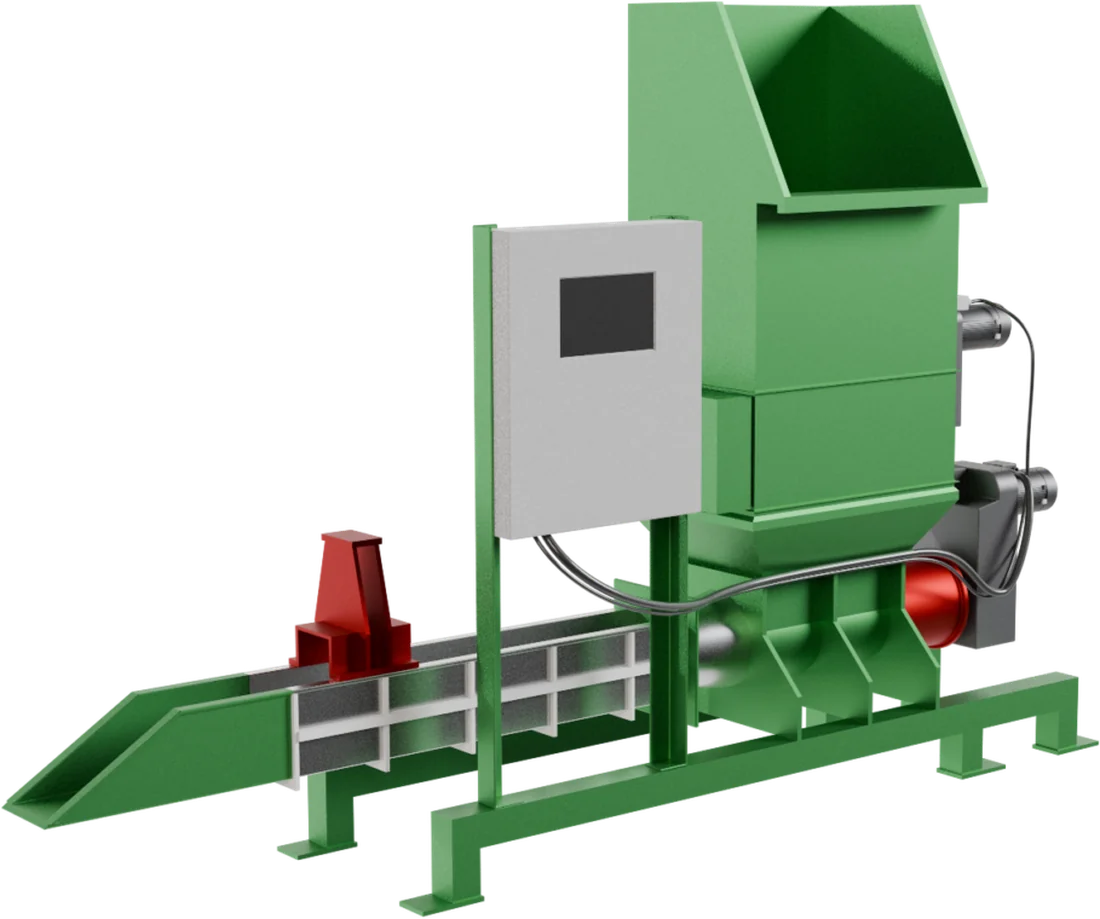
Illustrative batch.
What we stand for
Numbers instead of adjectives. Every statement about impact comes with a unit, a scope and a period.
Each step from source to result is recorded with time, place and responsibility, so the path can be followed back.
Anyone with a QR code or a report number can check the original record, without asking for permission.
Factors, sources and assumptions sit next to the result. When the method changes, the history stays.
Regulation
In Europe, what used to be good practice is becoming an obligation. Companies that already have the data are ahead.
Importers of steel, aluminium, cement, fertilisers, hydrogen and electricity start reporting embedded emissions.
The largest EU companies publish assured sustainability reports for the financial year 2024.
Embedded emissions become a cost. Verified supplier data replaces default values.
Under Directive (EU) 2024/825, vague claims need proof, and product claims of climate neutrality based on offsets are no longer allowed.
The world meets in Türkiye. Credible targets and honest reporting are part of the agenda.
Our ecosystem
Three connected tools cover the whole path: measuring emissions, tracing materials and turning recovered resources into evidence.
 Measure
Carbon accounting for companies. Scope 1, 2 and 3, CBAM workflows and reporting aligned with ISO 14064-1, prepared for audit.
 Trace
The digital chain of custody for EPS recycling. Every handover is scanned, and every batch gets a report anyone can verify by QR code.
 Recover
Physical recycling of EPS and plastics in Germany. Material that comes back becomes regranulate, with the data to prove it.
Free tools
Three free tools for a first look. They give estimates with sources; audit ready accounting happens in CO₂ Manager.
Estimate your annual emissions across the main activity areas of your organisation.
Try itFind out which scope an activity belongs to under the GHG Protocol.
Try itSee how prepared you are for EU CBAM reporting, step by step.
Try itClimate signals
Monthly mean at Mauna Loa, September 2026. One year earlier it was 424.37 ppm.
Source: NOAA Global Monitoring Laboratory, updated 9 Oct 2026. Line: annual means 2015 to 2024.
Above the pre-industrial level of 1850 to 1900. The years 2023 to 2025 were the first three-year period above 1.5 °C on average.
Source: Copernicus Climate Change Service, ERA5, January 2026.
UN Climate Change Conference at Antalya Expo Center, 9 to 20 November 2026. Hosted by Türkiye, with Australia leading the negotiations.
Source: University of Cambridge, CISL.
Climate Intelligence
Manifesto
Tell us what you want to make visible: emissions, materials or the whole chain. We will show you how it looks with your own numbers.